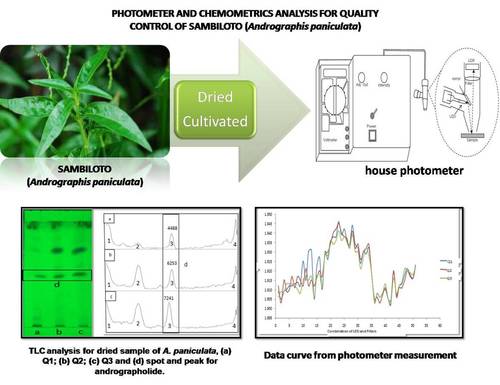
A Simple Photometer and Chemometrics Analysis for Quality Control of Sambiloto (Andrographis paniculata) Raw Material
Abstract

References
[1] Afendi FM, Okada T, Yamazaki M, Hirai-Morita A, Nakamura Y, Nakamura K, Kanaya S,2012, Plant Cell Physiol., 53(2), e1(1-12).
[2] Torri MC, 2012, J. Entrep., 21, 59-90.
[3] Rafi M, Wulansari L, Heryanto R, Darusman LK, Lim LW, Takeuchi T, 2015, Food Anal. Methods, 8(9), 2185-2193.
[4] Singh SK, Jha SK, Chaudhary A, Yadava RDS, Rai SB, 2010, Pharm. Biol., 48, 134-141.
[5] Astuti M, Rafi M, Darusman LK, 2017, IOP J. of Physics: Conf. Series, 835, 012018.
[6] Liang YZ, Xie P, Chan K, 2004, J. Chromatogr. B., 812, 53–70.
[7] Li M, Zhou X, Zhao Y, Wang DP, Hu XN, 2009, Bull. Korean Chem. Soc., 30, 2287-2293.
[8] Lucio-Gutiérrez, JR, Coello J, Maspoch S, 2011, Food Res. Int., 44, 557-565.
[9] Rohaeti E, Rafi M, Heryanto R, Syafitri UD, 2015, Spectrochim. Acta Part A: Mol. Biomol. Spectrosc., 137, 1244-1249.
[10] Zain, H., Tedjo, A., Kusmardi, 2007, Makara Kes., 11, 69-75.
[11] Jarukamjorn K, Nemoto N, 2008, J. Health Sci., 54, 370-381.
[12] National Institutes of Health. ImageJ software. https://imagej.nih.gov/ij/index.html. Accessed date 2 August 2016. [13] CAMO. The Unscrambler 9.7. http://www.camo.com. Accessed date 23 September 2014.
[14] Akowuah GA, Zhari I, Norhayati I, Mariam A, 2006, J. Food Comp. Anal., 19, 118-126.
[15] Rafi M, Nurasiah E, Darusman LK, Syafitri UD, 2014, Indo. J. Pharm., 25(3), 145-152.
[16] Pandey AK, Mandal AK, 2010, IJEE, 1, 165-169.
[17] Miller JC, Miller JN, Statistics and Chemometrics for Analytical Chemistry, 6th ed., 2010, Pearson Education Limited, Harlow.
[18] Brereton, RG, Chemometrics: Data analysis for the laboratory and chemical plant, 2003, John Willey & Sons, Chichester.
Refbacks
- There are currently no refbacks.

This work is licensed under a Creative Commons Attribution-NonCommercial 4.0 International License.


